RFM analytics
RFM Analytics is an analytical tool that provides rankings for your contacts based upon their financial participation with the organization. It is a very commonly used tool for fundraising, but its applications are not limited to the fundraising marketplace. Any organization that targets contacts based on past participation can benefit from RFM Analytics.
With RFM Analytics, you can:
- Rank and organize your customer population into specific groups manually or automatically.
- Define ranking scores for recency, frequency, monetary, combined (calculated), and total (calculated) values.
- Create groups, such as quintiles, that reflect the relative ranking of customers according to all RFM measurements.
- Analyze transaction patterns to accurately predict future behavior.
- Define different customer population and transaction queries to include in each analysis.
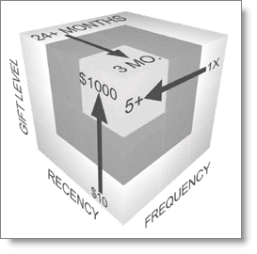
RFM Analytics relies upon three core elements that turn transactional data into a three-dimensional score based on:
- Recency – How long since the last transaction?
- Frequency – How often does this transaction occur?
- Monetary Value – How much are these transactions worth?
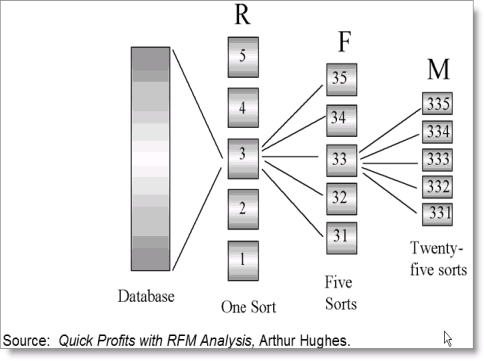
RFM Analytics scoring
Rankings, once run, result in a score being assigned to each record. This score is important because ranks contacts/prospects within a matrix of highest to lowest values.
There are different schools of thought about how to use RFM scores. Some organizations use the total score (1+1+1 = 3). Others use the product of the score (1*1*1 = 1) and others use a concatenation of the scores (111).
Example RFM ranking
Tips for implementing RFM Analytics:
- If you are running an RFM ranking for the first time, the automatic ranking might be able to help establish a first pass at quartiles or quintiles. However, make sure to review the results to see whether these rankings are correct for your organization. There is a danger in using and re-using automatic rankings for target marketing purposes. Automatic rankings will always produce equal buckets rather than telling you who is falling where based on typical transactional behaviors. After determining some basic highs and lows for each category, use the manual ranking to define those buckets and continue to evaluate the results.
- The key to successfully using RFM Analytics in any organization is having the patience to watch how people perform over a long period of time. Remember that anything can impact behavior and do not react immediately to changes. RFM buckets tend to remain stable.
- Build your queries separately. Do not use Save As to copy queries. There may be some unwanted criteria carried over from the original query.
- Make sure the transaction query Includes Quantity, Amount, and Transaction Date. These properties are used for the ranking. You can alias other properties if you wish, such as aliasing Date Received or Effective Date as the Transaction Date.
This diagram illustrates RFM Analytics core tasks by the approximate order they occur (top-left to bottom-right) and by the organizational area that performs them.
Task Map: RFM Analytics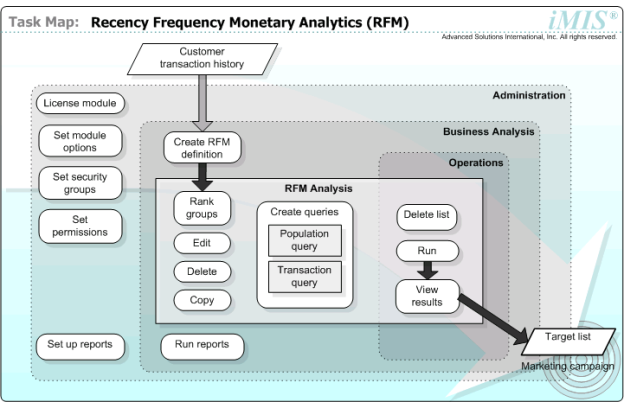
The following example uses RFM rankings to identify prospects for a specific campaign.
Interpret these rankings as:
- 1 – Donated once
- 5 – Donated from 2 to 5 times
- 10 – Donated from 6 to 10 times
- 15 – Donated from 11 to 15 times
- 20 – Donated from 16 to 20 times
- 25 – Donated from 21 to 25 times
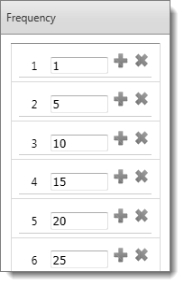
Interpret these rankings as:
- 1 – Donated once
- 5 – Donated from 2 to 5 times
- 10 – Donated from 6 to 10 times
- 15 – Donated from 11 to 15 times
- 20 – Donated from 16 to 20 times
- 25 – Donated from 21 to 25 times
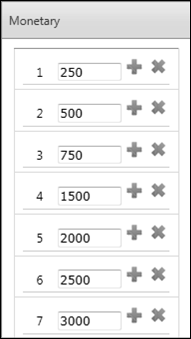
Interpret these rankings as:
- 250 – Amount donated is 250 or less
- 500 – Amount donated is 251 to 500
- 750 – Amount donated is 501 to 750
- 1500 – Amount donated is 751 to 1500
- 2000 – Amount donated is 1501 to 2000
- 2500 – Amount donated is 2001 to 2500
- 3000 – Amount donated is 2501 to 3000
RFM Analytics requires that two queries work together:
- Population query – Determines who will be analyzed
- Transaction query – Determines what will be analyzed (for example, date, quantity, amount)
Tips for creating RFM Analytics definitions
- You can copy and edit existing RFM definitions for efficiency.
- After you define the RFM analysis, you can run it repeatedly to create or update the list of segments generated.
Make sure the population query and transaction query are set up.
- Select Marketing > RFM > Run analytics.
- From the New drop-down list, select RFM Definition.
- Identify each RFM model with a unique name (duplicate names are allowed).
- Determine whether ranges should be set automatically or manually:
- When setting ranges automatically, enter a value greater than zero for at least one range.
- When setting ranges manually, specify the Recency, Frequency, and Monetary ranges.
- The query is saved to the default RFM Process Engine folder unless specified otherwise.
- RFM Analytics divides the number of groups specified using the following procedure when groups are ranked automatically:
- Sorts lists based on criteria (Recency, Frequency, and Monetary)
- Divides the population equally into the specified number of groups
- Starts at the top of the list and ranks each contact based on the group
- Creates an equal number of contacts for each group:
- The lowest-numbered group corresponds to the least desirable ranking.
- The highest-numbered group corresponds to the most desirable ranking.
- The last group may contain a different number of contacts than the other groups depen ding on the population and number of groups.
- Some groups will be empty if the number of contacts is less than the number of groups.
- Two contacts with the same score may be placed in different groups.
When ranking groups manually, you must enter criteria for each ranking group.
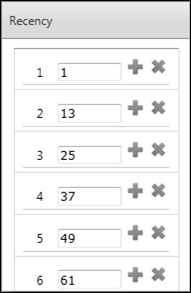
Example: Manually ranking RFM values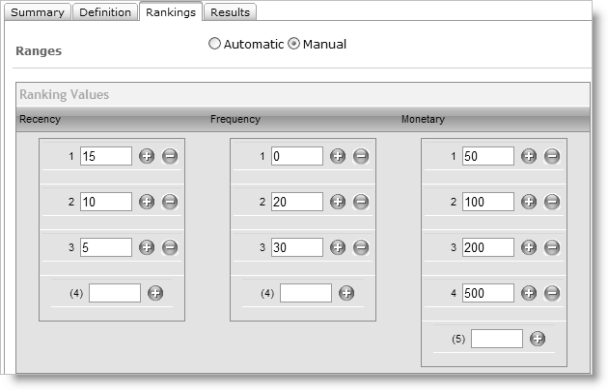
Note: When defining your manual rankings, you should use higher numbers for more desirable rankings and lower numbers for less desirable rankings to conform to industry standards for RFM rankings.
The criteria for ranking Recency is based on the last time the individual had contact with the organization. The date used is based on the Transaction Date specified in the Transaction Query. The following example illustrates how Recency is ranked:
- Group 1: >10 days and <=15 days, value = 15
- Group 2: >5 days and <=10 days, value = 10
- Group 3: <=5 days
The criteria for ranking Frequency is based on the number of times the individual had contact with the organization. The value is calculated by the number of records for an individual in the Transaction Query. The following example illustrates how Frequency is ranked:
- Group 1: <20 times and >=0 times, value = 0
- Group 2: <30 times and >=20 times, value = 20
- Group 3: <50 times and >=30 times, value = 30
- Group 4: >=50 times, value = 50
The criteria for ranking Monetary is based on the amount of money the individual has spent with the organization. The amount is based on the total amount from the Transaction Query. The following example illustrates how Monetary is ranked:
- Group 1: <0 and >=50, value = 50
- Group 2: <50 and >=100, value = 100
- Group 3: <100 and >=200, value = 200
- Group 4: >200 and >=500, value = 500
- Select Marketing > RFM > Run analytics and open the RFM analysis definition.
- Click Run. A status message displays on the Summary tab. If an error message such as "An error has occurred while generating Lists" appears, click on the message to see more details.
- View the results on the Results tab.
- Select Marketing > RFM > Run analytics and open the RFM analysis definition.
- Select contacts from the following RFM criteria:
- Recency ranking
- Frequency ranking
- Monetary ranking
- Combined ranking
- Total ranking
- First amount
- First amount date
- Last amount
- Last amount date
- Highest amount
- Highest amount date
- To purge the results, select Delete List.
- To create a query for use in Campaigns, select Create Query.
RFM rankings can be used as the basis for segmentation. Segmentation assists with targeting the market or the segment of the database who is most likely to respond to the marketing effort. For example, if your marketing department is trying to mail the company contact of their best conference attendees, they might look for:
- Recency going back 5 years
- Frequency of attendance being greater than ten times attending (because this would imply that at least two attendees from that company attended within those 5 years)
- Value = to increments of conference registration because that's the value of their attendance (anyone with a value higher than that might have purchased books at the conference or made a donation above and beyond the registration fee).
You can use the same ranking model against different groups or populations within your database to be able to make predictions and better target who is most likely to respond to a particular marketing effort. The RFM rankings may look the same, but the numbers within each rank may be quite different.